AMPL interest rate curve adjustment
Following AIP-26 it was noticed that the interest accrued for the AMPL market above 75% utilization is higher than expected. After investigation the reason for the discrepancy was identified to be the following:
In AAVEs MathUtils there is an over-approximation in the application of the interest rate for computing compounded interest.
In calculateCompoundedInterest method
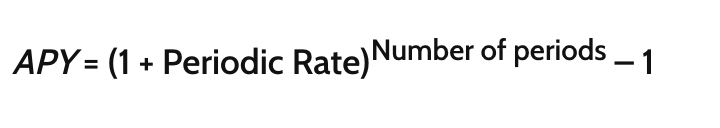
Periodic rate (per second) is computed as:
uint256 ratePerSecond = rate / SECONDS_PER_YEAR;
in comparison to the exact computation.

| Expected APY | Effective APY | Expected daily rate | Effective daily rate |
|---|---|---|---|
| 4.00% | 4.08% | 0.01% | 0.01% |
| 5.00% | 5.13% | 0.01% | 0.01% |
| 10.00% | 10.52% | 0.03% | 0.03% |
| 50.00% | 64.87% | 0.11% | 0.14% |
| 100.00% | 171.83% | 0.19% | 0.27% |
| 200.00% | 638.91% | 0.31% | 0.55% |
| 1000.00% | 2202543.09% | 0.68% | 2.78% |
| 10000.00% | 2.69E+43% | 1.30% | 31.52% |
This difference is especially noticeable in the AMPL market, where the configured interest rate can go up to 10,002% at max utilization.
The AAVE Genesis team has been made aware and they will publish more guidance on the discrepancy.
This snapshot vote proposes two different curve configurations to adjust for the over-approximation:
Curve #1 Rationale
As mentioned in AIP-26, a nonlinear interest curve is more suited for AMPL's market and potentially other assets on AAVE's platform. It turns out that this over-approximation produces just such a curve.
The over-approximation mentioned above results in an exponentially growing curve which allows for defining a more suitable interest curve for AMPL. We propose the following parameters for AAVE's default interest rate strategy, which produce the curve below:
| Optimal Utilization | Base rate | Slope1 | Slope2 | Maximum Effective APY |
|---|---|---|---|---|
| 80 | 1.00% | 2.00% | 750.00% | 186210.38% |

APY table above 80% Utilization:
| Utilization | APY |
|---|---|
| 80.00% | 3.05% |
| 81.00% | 49.93% |
| 82.00% | 118.15% |
| 83.00% | 217.40% |
| 84.00% | 361.82% |
| 85.00% | 571.94% |
| 86.00% | 877.67% |
| 87.00% | 1322.50% |
| 88.00% | 1969.72% |
| 89.00% | 2911.43% |
| 90.00% | 4281.60% |
| 91.00% | 6275.19% |
| 92.00% | 9175.85% |
| 93.00% | 13396.29% |
| 94.00% | 19536.98% |
| 95.00% | 28471.63% |
| 96.00% | 41471.48% |
| 97.00% | 60386.14% |
| 98.00% | 87906.81% |
| 99.00% | 127949.14% |
| 100.00% | 186210.38% |
Rationale:
- Accounting for the over-approximation of the existing Slope2=10,000% interest curve requires reducing the slope2 parameter.
- Taking advantage of the exponential curve allows for: a. Setting a higher optimal utilization rate. b. Setting a higher maximum APY to reduce the potential for utilization being at 100% for extended periods. without creating a too steep of an interest rate increase right above the optimal utilization rate.
Curve #2 Rationale:
- Accounting for the over-approximation of the existing Slope2=10,000% interest curve requires reducing slope2 parameter.
- Adjust curve parameters to have maximum APY similar to the intended APY in AIP-26 This causes this curve to have higher likelihood for periods at 100% utilization compared to curve #1.
| Optimal Utilization | Base rate | Slope1 | Slope2 | Maximum Effective APY |
|---|---|---|---|---|
| 80 | 1.00% | 2.00% | 460.00% | 10151.40% |

| Utilization | APY |
|---|---|
| 80.00% | 3.05% |
| 81.00% | 29.69% |
| 82.00% | 63.23% |
| 83.00% | 105.44% |
| 84.00% | 158.57% |
| 85.00% | 225.44% |
| 86.00% | 309.60% |
| 87.00% | 415.52% |
| 88.00% | 548.83% |
| 89.00% | 716.62% |
| 90.00% | 927.79% |
| 91.00% | 1193.58% |
| 92.00% | 1528.10% |
| 93.00% | 1949.13% |
| 94.00% | 2479.03% |
| 95.00% | 3145.97% |
| 96.00% | 3985.38% |
| 97.00% | 5041.86% |
| 98.00% | 6371.54% |
| 99.00% | 8045.08% |
| 100.00% | 10151.40% |
Off-Chain Vote
Curve #1
84.62K 99.8%
Curve #2
1.98 0%
Abstain
153.43 0.2%
Timeline
Sep 02, 2021Proposal created
Sep 03, 2021Proposal vote started
Sep 06, 2021Proposal vote ended
Oct 26, 2023Proposal updated